The work · Field report No. 01
One vineyard, end to end.
This is a complete vineyard job, shown the way it actually ran: the brief, the flight, and everything that came back. The site is a working vineyard in Summerland. We keep it unnamed here, and that's the same discretion every job gets. Every map, number and page below is real data from this one flight.
Part one
The brief.
Three blocks of wine grapes on a Summerland hillside. Each block has its own shape, slope and character, and no two corners of any of them grow quite the same. The brief was the one most growers would recognize: show where the canopy is strong, where it's thin, and where to walk first, block by block, without guessing from the truck.
We flew the site as a complete demonstration of our vineyard program and carried it through every stage a client job gets: one flight, all three blocks, processed in-house, delivered as maps, a live viewer and a plain-language report. What's on this page is that delivery.
Part two
The flight.
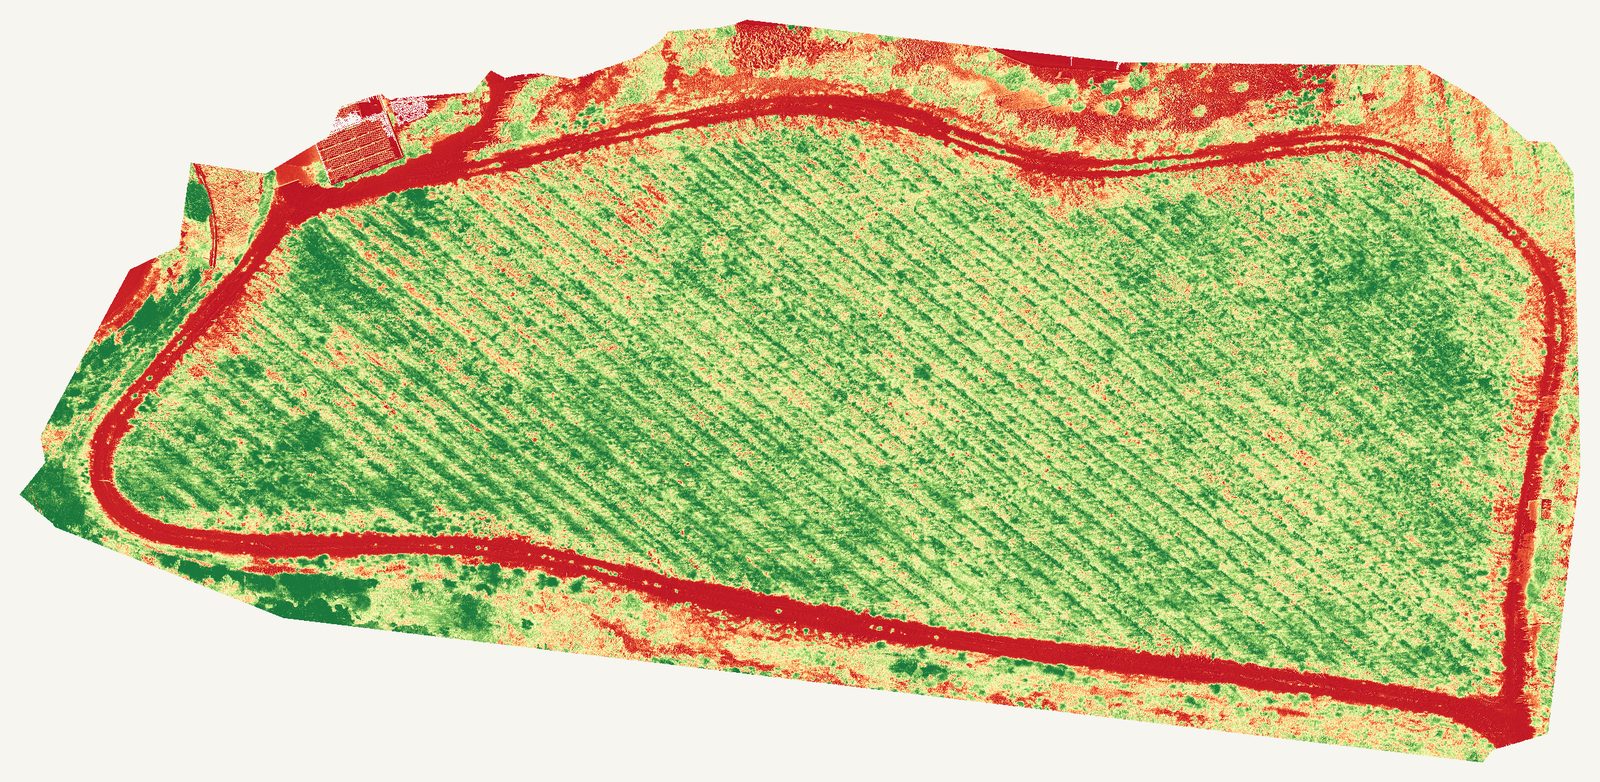
The DJI Mavic 3 Multispectral did the flying. Alongside its colour camera it carries four narrow-band sensors: green, red, red edge and near infrared. Healthy canopy reflects near-infrared light strongly; thin or struggling canopy doesn't. That difference is invisible from the ground, and it's what every vigor map on this page is built from.
- Aircraft
- DJI Mavic 3 Multispectral: one aircraft, one flight, all three blocks on 19 June 2026
- Capture
- True-colour photography plus four spectral bands over every row, with a built-in sunlight sensor logging ambient light through the flight
- Detail
- Finished maps resolve to roughly 1.7 cm per pixel: individual vines, posts and wheel tracks are all readable
- Calibration
- On program flights, a reflectance calibration panel is photographed before takeoff so maps stay comparable season over season. Within this single capture, every map reads as relative vigor: it ranks stronger and weaker canopy inside that one map
- Reading
- Relative patterns for grower and agronomist review. The maps say where to look; the decision about why, and what to do, stays with you and your agronomist
Part three
What came back.
The full delivery, live on this page: the interactive viewer a grower actually opens, the map layers behind it, and the report that ties the whole job together. Load them and look around.

- From this flight
- Interactive
- Opens in the page
The live viewer
The same viewer a grower receives: pick a block, flip between seven layers, and read the plain-language notes beside each map. Nothing loads until you press the button.

The pattern jumps out in seconds: a strong core, softer edges, and exact rows to walk first. For grower and agronomist review.

The photo layer that anchors every map. This is the same block as the vigor map at the top of the page, in true colour: what each coloured zone actually looks like on the ground.
The report
Maps are only half the delivery. The report walks through each block in plain words: what stands out, where to walk first, and how to read each layer. This is the actual document from this job, anonymized.
Also in the lab
More proof in the lab.
This page is a vineyard job, but the same pipeline maps sites and estates. If you build, manage, or own property, open the Blair Street twin: a real 3D mesh, a classified point cloud, and a zoomable map.
The digital twin lab
Our own Blair Street capture, live in the browser: a 3D house mesh, a classified point cloud, a zoomable map and a flythrough.
Open the twin labCase study · Blair Street
A whole property followed stage by stage, from first call to final walkthrough, with the real numbers at every step.
Read the case studyRequest a quote
Want this flown over your own blocks?
Tell us about your vineyard, orchard or site and we'll come back with straight answers and a clear scope. Same flight, same delivery, your ground.
Every inquiry gets a reply within one business day.