Scope call
A short conversation about what you need, what we'd fly, and exactly what you'll receive, put in writing before anything leaves the ground.
What you walk away with: a written scope and a capture date
What you get · From first call to final folder
Five steps from first call to a shared folder of real, usable files. Every step on this page shows you something you can open.
The journey · The same five steps, every job
A short conversation about what you need, what we'd fly, and exactly what you'll receive, put in writing before anything leaves the ground.
What you walk away with: a written scope and a capture date
Every flight is planned against current airspace rules through NAV Drone. If your site needs additional authorization, you hear about it at the scope call, not on capture day.
What you walk away with: a flight plan that's cleared to fly
RTK positioning on every flight, a reflectance-panel capture on program multispectral flights, and GCP targets placed when a job needs independent ground reference.
What you walk away with: data captured to a documented standard
We capture with DJI aircraft, and the same pilot who flew your site processes every file at our own desk. DJI Terra builds the maps and 3D models. Measurements come out of Virtual Surveyor, licensed measurement software for surfaces, contours, volumes, and cut-and-fill. Interactive 3D is packaged through streamed viewers that open in any browser, and multispectral crop health is processed in-house. Nothing waits in someone else's queue.
What you walk away with: georeferenced outputs in NAD83(CSRS)
A shared client folder, interactive 3D where the job calls for it, and a short call to walk through what the data actually shows, with written findings prepared for grower and agronomist review where that applies.
What you walk away with: deliverables you can open, share, and act on
Once, or as an ongoing program on the schedule you set. Recurring captures are flown the same way each time, so you're comparing your site to itself.

The delivery folder
When processing wraps, a shared client folder lands in your inbox. No login walls, no proprietary platform. Just a clean folder you can open, share with your team, and archive. Here is what the folder looks like.
KV-2026-YOURNAME/
├── Orthomosaic/
│   ├── yoursite-ortho.tif          ← georeferenced, NAD83(CSRS)
│   └── yoursite-ortho-preview.jpg
├── 3D-Model/
│   ├── yoursite-mesh.glb           ← open in any 3D viewer
│   └── interactive-link.txt        ← browser link, share anywhere
├── Point-Cloud/
│   └── yoursite-points.las         ← classified ground / above-ground
├── Report/
│   └── KV-Report-YOURNAME.pdf      ← plain-language report
├── Source-Flight/
│   └── raw-images-ARCHIVED.zip     ← original captures, archived
└── README.txt                      ← what each file is and how to open it
.glb mesh file and a browser link. Load it in any 3D viewer, or share the link with anyone who needs to see the property in three dimensions..las file with ground and above-ground classes, compatible with standard point-cloud tools. On mapping jobs it is the basis for DSM and DTM outputs.The formats
The folder above is a typical job; across everything we fly, this is the full set. Some of it opens in your browser with nothing to install: the interactive 3D link, the streaming maps, the PDF. The rest opens in your tools: QGIS, ArcGIS, CAD, spreadsheets, Google Earth. Every georeferenced layer is delivered in NAD83(CSRS), nothing locked behind a subscription. Tell us what your team runs and we match the deliverable to it.
The clean top-down map, plus multispectral vegetation-index layers (NDVI, NDRE, GNDVI, OSAVI, LCI), ready to open in QGIS, ArcGIS, or any GIS.
A digital surface model and a bare-earth terrain model, the foundation for slope, drainage, and cut-and-fill work.
Contour lines and topographic reference for engineering use, dropping straight into a CAD planning set.
Every measured point, separated into ground and above-ground returns. This is the dataset surfaces and volumes are built from.
The property as a full 3D mesh for any 3D viewer, plus an interactive browser link you can share with anyone.
Zones, counts, and points as ready-to-edit GIS layers you can open beside your own data.
Class areas, measured volumes, and counts as spreadsheet data you can sort, chart, and track.
The findings written up page by page: cover stats, maps, and observations, ready to forward.
4K cinematic flythroughs, short vertical social cuts, and high-resolution stills for presentations and the file.
Your maps draped straight onto Google Earth. Double-click to open and fly across the property in a tool nearly everyone already has.
A georeferenced map for the free Avenza app. Open it on a phone or tablet with no signal, see your live position, and take planning-grade reference measurements right in the field.
Cloud-optimized versions of the orthomosaic and point cloud that stream in a browser, so you can pan and zoom through huge datasets without a giant download.
The proof · The report
The deliverable is a plain-language report, not a raw data dump: maps a grower can read, a guide to each layer, and observations written for grower and agronomist review. This sample is the full three-block, 21-page report from one multispectral flight over a Summerland vineyard. The first seven pages are below; click any page to read it.
The proof · The live link
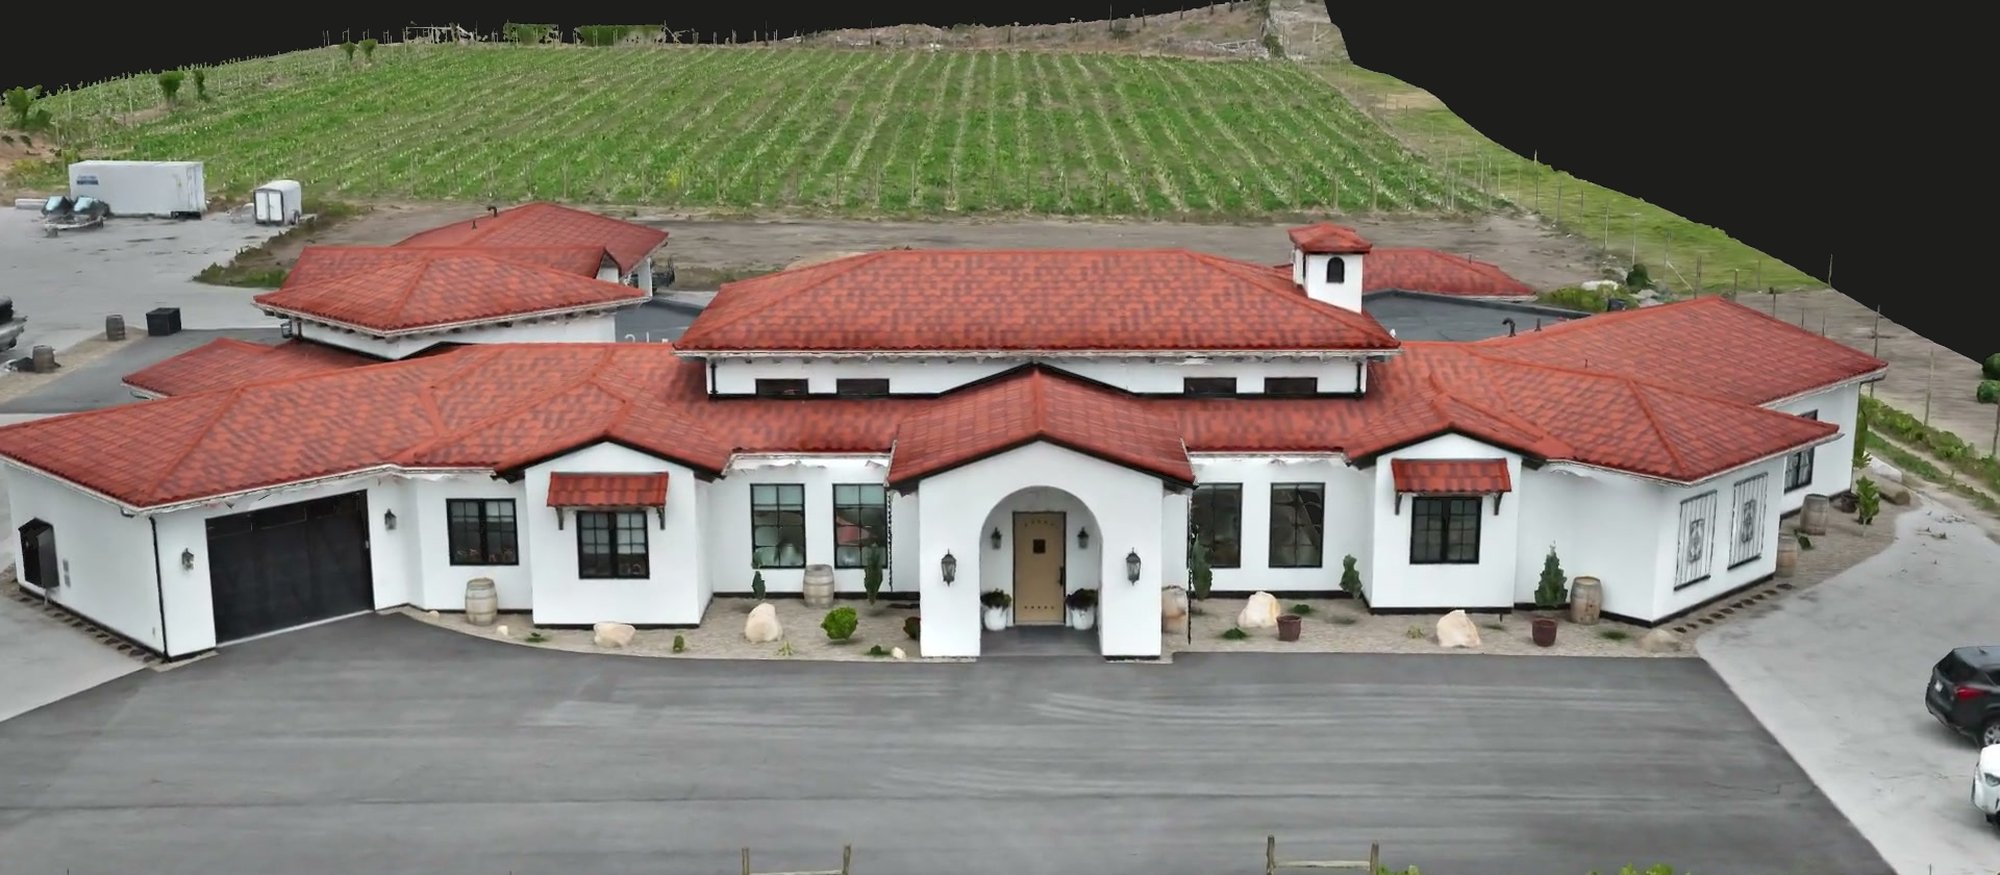
Every 3D job includes a browser link you can open on any device and share with a realtor, designer, contractor, or insurer. No software to install. No account required. This is what the link delivers. Load the demonstration twin and look around.

This is our own Blair Street demonstration capture, the same kind of interactive file your clients and collaborators open from the link in their inbox. Drag to orbit, scroll to zoom, pinch on mobile. The .glb source file travels in the shared folder alongside it.
Start here
The quote you get is the price you pay, and the same person answers your inquiry, flies the site, processes the data, and walks you through it.
Every inquiry gets a reply within one business day.