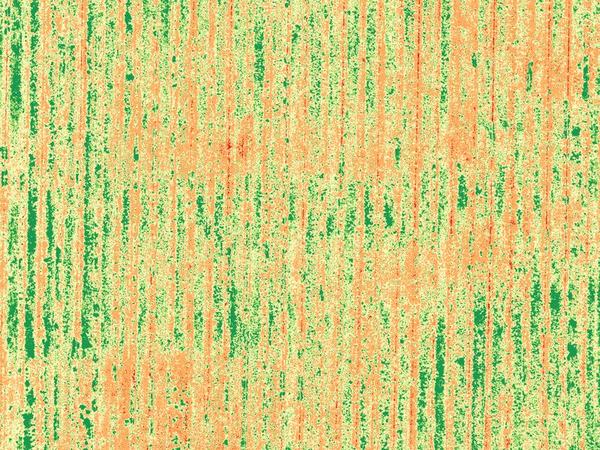
Five-index relative-vigor maps
NDVI, NDRE, GNDVI, OSAVI, and LCI from one flight, cross-checking each other: a zone that reads low across several indices is a stronger signal than one that dips in one.

Vineyard & orchard country · Oliver & Osoyoos · South Okanagan
A weak corner of a block is easy to miss on foot and costly when you do. One flight reads the whole planting, strongest zones to weakest, so you know where to walk first. It's a relative read for you and your agronomist. Flown from Summerland, a short drive down the valley.
Why this corner of the valley
The stretch from Okanagan Falls through Oliver to Osoyoos packs in vineyards and orchards at a density few places in Canada match, on benches, fans, and lake-bottom soils that change block to block. The more rows you manage, the more one capture is worth.

Long heat units and thin rainfall mean water and canopy decisions carry weight every week. A vigor read shows where the heat is biting before it shows up in the fruit.
Soils shift sharply across short distances here, and so does vigor. Zones drawn from the air follow how the ground behaves rather than the row numbers on a map.
The gap between what you can walk and what you can see from above is widest here. One flight covers ground that takes days on foot.
Crop health · The core read
One flight shows you which zones are struggling before harvest does. It tells you which zones are pulling, which are holding, and which need a closer look this week, with observations written for you and your agronomist.

NDVI, NDRE, GNDVI, OSAVI, and LCI from one flight, cross-checking each other: a zone that reads low across several indices is a stronger signal than one that dips in one.
A count of vines or trees, mapped to where each one stands: a starting point for replant planning and inventory.
Missing vines, dead trees, and skips in the planting pattern, flagged by location. Easy to lose track of on foot, obvious from above.
Vigor patterns drawn into zones, so water and inputs can follow the canopy rather than the calendar. A dry line or failing emitter shows up as a pattern you can check.
Tree-by-tree vigor, gap detection, and tree counts: the vineyard workflow, tuned to orchard canopy for stone fruit and apples.
This year's flight set against last year's, panel-referenced so the comparison holds: a record of what's trending where.
Multispectral maps show relative vigor for grower and agronomist review: they identify zones to look at, not what to do about them. A reflectance-panel capture on every flight keeps maps comparable across dates and block to block.
What you receive
A vigor flight is built to end in a plain-language PDF: true colour, five indices, area-by-class tables, and written observations. What's in yours is set at the scoping call. You can open a real delivery, report included, right on this site.
What this looks like · Demonstration captures
We don't show projects we haven't done. Everything here is our own work from elsewhere in the South Okanagan, never presented as Oliver or Osoyoos jobs.
Our own 5.3-acre Summerland block, flown and processed in-house: five indices, zone maps, and the kind of report a vigor flight produces.
Our own Blair Street capture: 6,052 images at 100% RTK FIX, 3.6 cm georeferencing RMSE, 0.3 cm/px delivered pixel detail, built into an interactive 3D twin. It shows the detail this workflow can reach. Each job is scoped to what it needs.
A creek corridor with steep relief, built from the bare-earth terrain model.
It's not just vineyards. I also map sites and measure stockpiles.
Vineyards aren't the only ground that moves down here. Oliver and Osoyoos carry gravel pits, subdivisions, and development sites, and the same RTK capture delivers planning-grade orthomosaics, elevation surfaces, and stockpile volumetrics for them.
One georeferenced top-down image of the site, scaled true, stitched into a single map you can measure off.
For planners · developers · contractors. Deliverables: georeferenced orthomosaic · shared client folder
Measured volumes from the 3D model, repeatable pile to pile and month to month.
For gravel pits · aggregate · contractors. Deliverables: measured-volume figures · model + screenshots
A digital surface model plus a bare-earth terrain model for slope, drainage, and cut-and-fill work.
For earthworks · drainage · site teams. Deliverables: DSM · DTM · georeferenced in NAD83(CSRS)
The same site flown on a schedule: a running record, with a georeferenced as-built at the end.
For developers · contractors. Deliverables: recurring orthomosaics · as-built · shared folder
High-resolution roof and exterior imagery, captured without ladders, for the owner and their roofer to review. Visual imagery only, never a structural, engineering, or insurance assessment.
For homeowners · property managers · roofers. Deliverables: roof & exterior imagery · shared client folder
Volumetrics are inventory and management figures from the 3D model, prepared for qualified professional review where a certified figure is required.
On the community's terms
This part of the valley includes Osoyoos Indian Band lands. For First Nations land and cultural sites we provide interactive 3D and georeferenced imagery, captured under the Nation's own direction and organized for stewardship, planning, and archival use. The direction stays with the Nation.
Local to the valley
Kendal Ventures works out of Summerland, a straightforward run down Highway 97, built on more than seven years of Okanagan vineyard and civil experience. Every flight is planned against current airspace rules before capture day; extra authorization gets flagged at the scope call.
A Summerland base means clear-sky windows we can read and a flight timed to your block.
The same Transport Canada-certified RPAS pilot flies your block and processes the data. Mapping deliverables come georeferenced in NAD83(CSRS).
Questions & answers
Yes. We're based in Summerland, a short drive down Highway 97, and Okanagan Falls through Oliver to Osoyoos is core service area. We schedule around your block and a clear-sky window.
No. A vigor map shows observed vigor variability and identifies zones for grower and agronomist review. It is not a diagnosis and never a treatment prescription. The cause, and the fix, is a call for you and your agronomist.
Yes. Vine and tree counts, mapped to where each one stands, plus gap and miss detection. That is the kind of read one flight gives you, scoped to what your blocks need.
Yes. The same capture delivers orthomosaics, elevation surfaces, and stockpile volumetrics for gravel, aggregate, and development sites; see the construction, commercial & public page.
Imagery and 3D, yes, under the Nation's own direction: georeferenced imagery and interactive 3D of land and cultural sites, organized for stewardship, planning, and archival use. Direction stays with the community.
More from the air
The same capture that maps your blocks serves the rest of the valley too.
Request a quote
Every project starts with a short scoping conversation: which blocks, when in the season, and exactly what you'll receive.