A whole-block read on how the canopy is doing
From the ground, you see the rows in front of you. A multispectral drone flight gives you the other view: the entire block at once, read in bands of light the eye can't see. The aircraft carries a sensor that records reflectance in red, green, red-edge, and near-infrared, and the way a leaf reflects those bands shifts with how vigorous the canopy is. Run that reflectance through a vegetation index and you get a map: where the canopy is pushing, where it's holding back, and how those zones lay across the block. These are relative-vigor maps: they rank the block against itself, strong zones against weak ones, so you can see the pattern and decide where to walk.

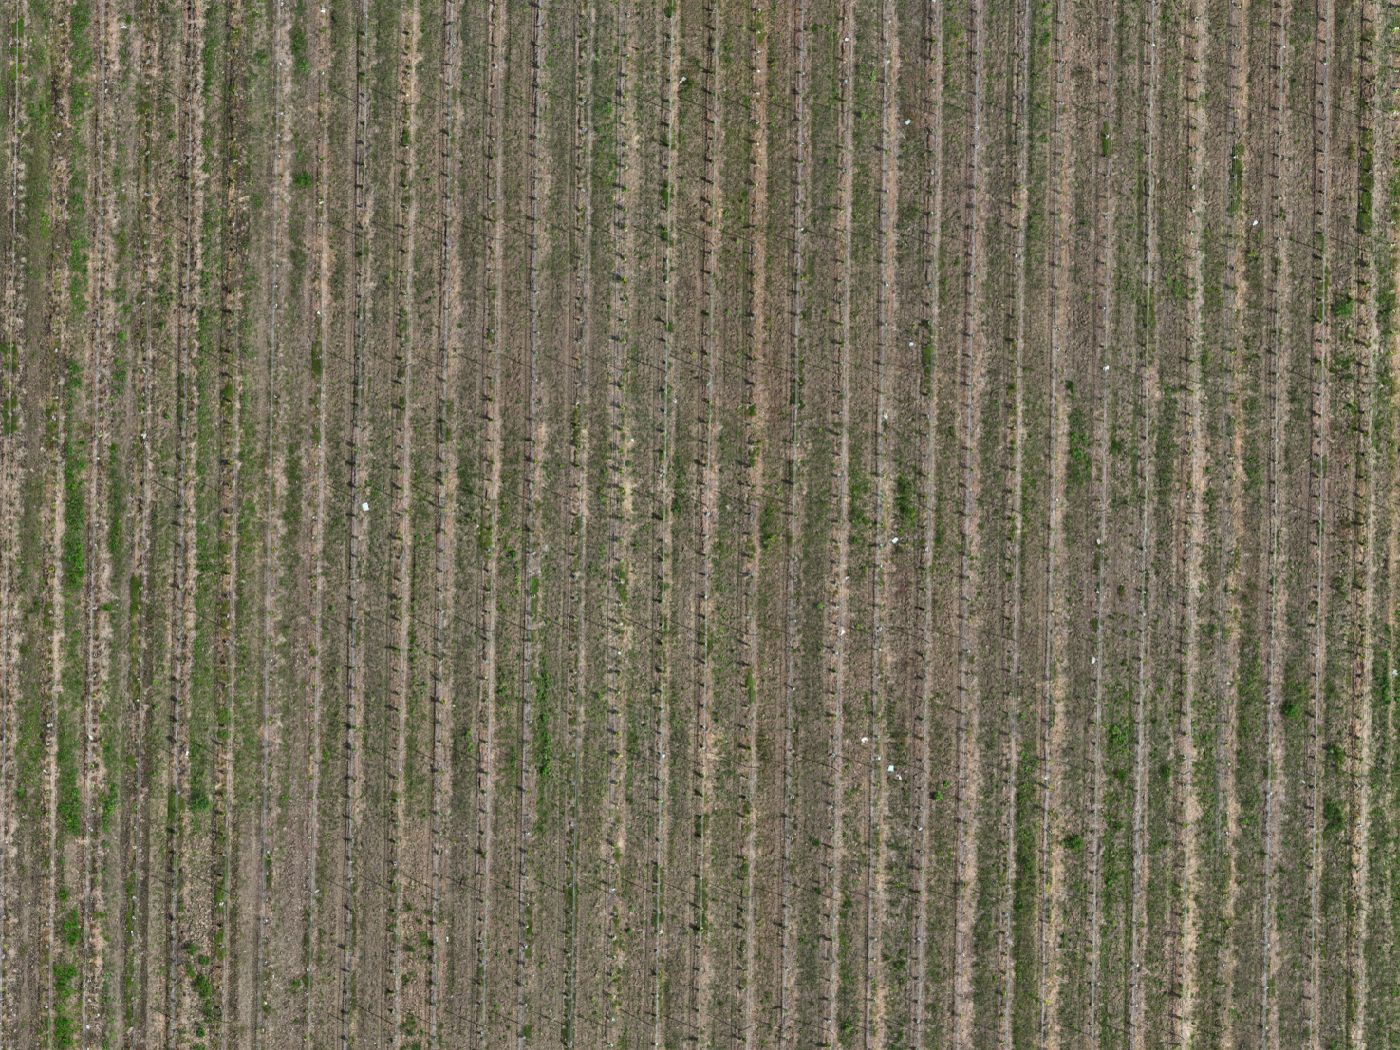
- Demonstration capture
- Multispectral · 5 indices
- RTK FIX
- Summerland BC
Drag the handle to compare the RGB orthomosaic against the relative-vigor map of the same rows, georeferenced to the same extent, then switch between NDVI, NDRE, GNDVI, OSAVI, and LCI to see how each index reads the canopy. Zones of observed vigor variability are identified for grower and agronomist review. These demonstration maps show relative vigor within a single flight, from the company's own capture of a Summerland vineyard block.
The five indices, in plain language
No single index tells the whole story, which is why we map five from one flight and read them together:
- NDVI: the overall vigor picture. The broadest, most familiar read on how much healthy, active canopy is there. Good for seeing big patterns at a glance.
- NDRE: reads deeper into the canopy. It leans on the red-edge band, which sees past the top leaves and into chlorophyll, so it stays useful in a dense, mid-season canopy where NDVI starts to flatten out.
- LCI: a leaf-chlorophyll read that, like NDRE, tracks chlorophyll content and cross-checks what the red-edge is telling you.
- GNDVI: leans on the green band, sensitive to greenness and the canopy's chlorophyll in a different way than the red-based indices.
- OSAVI: soil-corrected. Vineyards have bare ground and cover crop showing between the rows, and that soil can skew a vigor read; OSAVI is built to pull the soil signal back out so you're seeing the vine, not the dirt.
Why bother with several? Because each one looks at the canopy a little differently, they cross-check each other. A zone that reads low across NDVI, NDRE, and OSAVI is a far stronger signal than one that only dips in a single index, which might just be soil, shadow, or a quirk of that one band. Several indices agreeing is what turns a colourful picture into something you can trust enough to act on.
What in-block variation actually reveals
The value isn't the average. It's the variation. A whole-block map shows you where the canopy is consistently ahead and where it consistently falls off, panel by panel, often in patterns that track soil changes, water, drainage, or an old problem corner you already half-suspected. That's the real output: not a number, but a set of zones. The strong zones tell you what "good" looks like in this block this year; the weak zones are the ones to put your boots in. The map doesn't replace walking the rows; it tells you which rows to walk, so a morning of scouting lands where it matters instead of being spread evenly over ground that's fine.
Why calibration makes the maps comparable
Light changes hour to hour, day to day, across a season. Without a reference, a map flown under bright sun and one flown under haze aren't truly comparable, even of the same block. That's what the reflectance-calibration panel is for. Before the aircraft maps your block, it captures a known reference panel on the ground, and the multispectral data is anchored to it. With that panel capture part of the workflow on every multispectral flight, the indices read against the same reference each time, so this year's veraison flight can be set against last year's, and one block against another, as a real baseline for change rather than colour that drifts with the weather.
The honest boundary
Here's the line that matters. These are relative-vigor maps. They show observed vigor variability and identify zones for grower and agronomist review, and that's exactly as far as they go. A multispectral map is not a diagnosis of disease, deficiency, or pest, and it is never a treatment prescription. A low-vigor zone tells you something is different there; what is different, and what to do about it, is a call for you and your agronomist, made with what you know about the block, the season, and what the indices are pointing at. The map is the starting point for that conversation, not a substitute for it. Used that way, as a precise, repeatable view of where to look, it earns its place in how the block gets managed.