Green strongest, red weakest
The colours grade the vines on a curve within each block. Red does not mean dead. It means look here first.
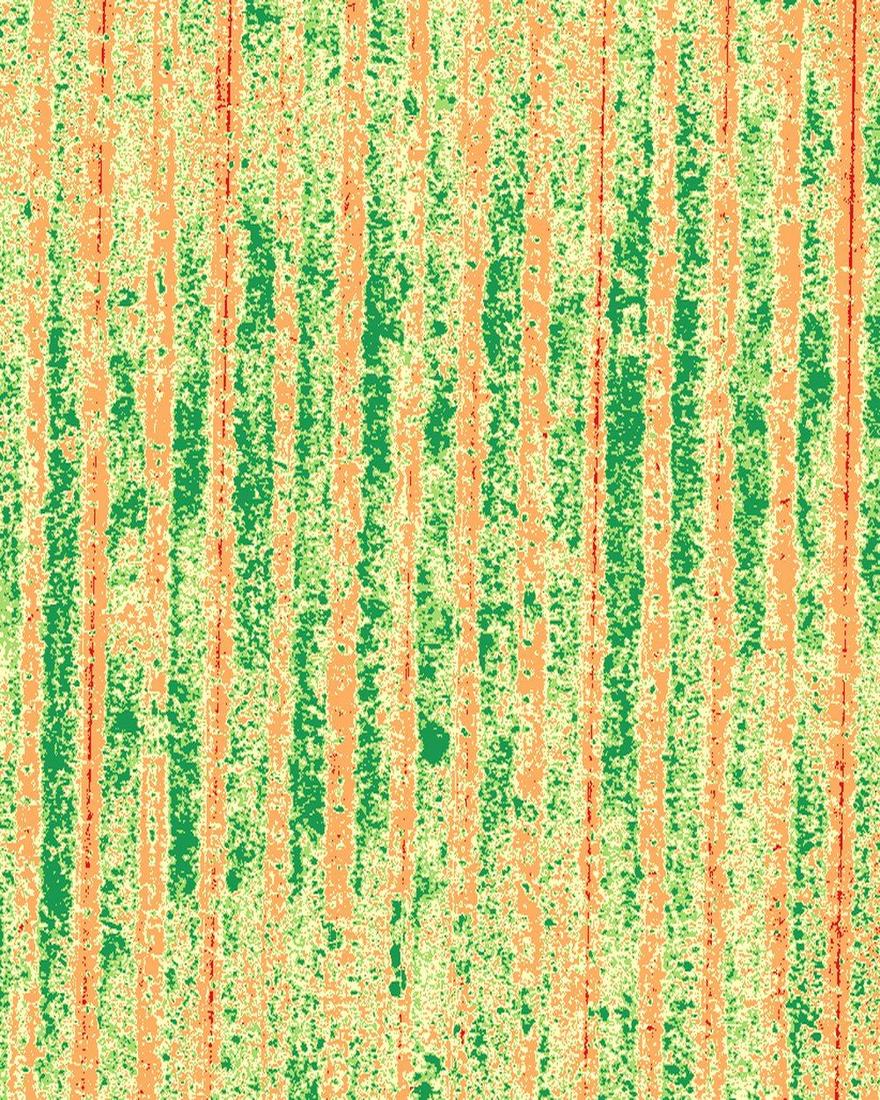
Relative crop vigor · vineyard block · Demonstration capture
Where is growth weaker? Is irrigation running uneven? Which rows should the crew inspect first? One flight over your block helps answer those questions. Captured and processed here in the South Okanagan.
The flagship · Crop-vigor mapping
A multispectral drone scan helps show differences across a block that may not be obvious from the ground. The report highlights stronger and weaker areas so your team knows where to inspect first. Drag the handle: our own capture of a Summerland block, shown as you'd receive it.

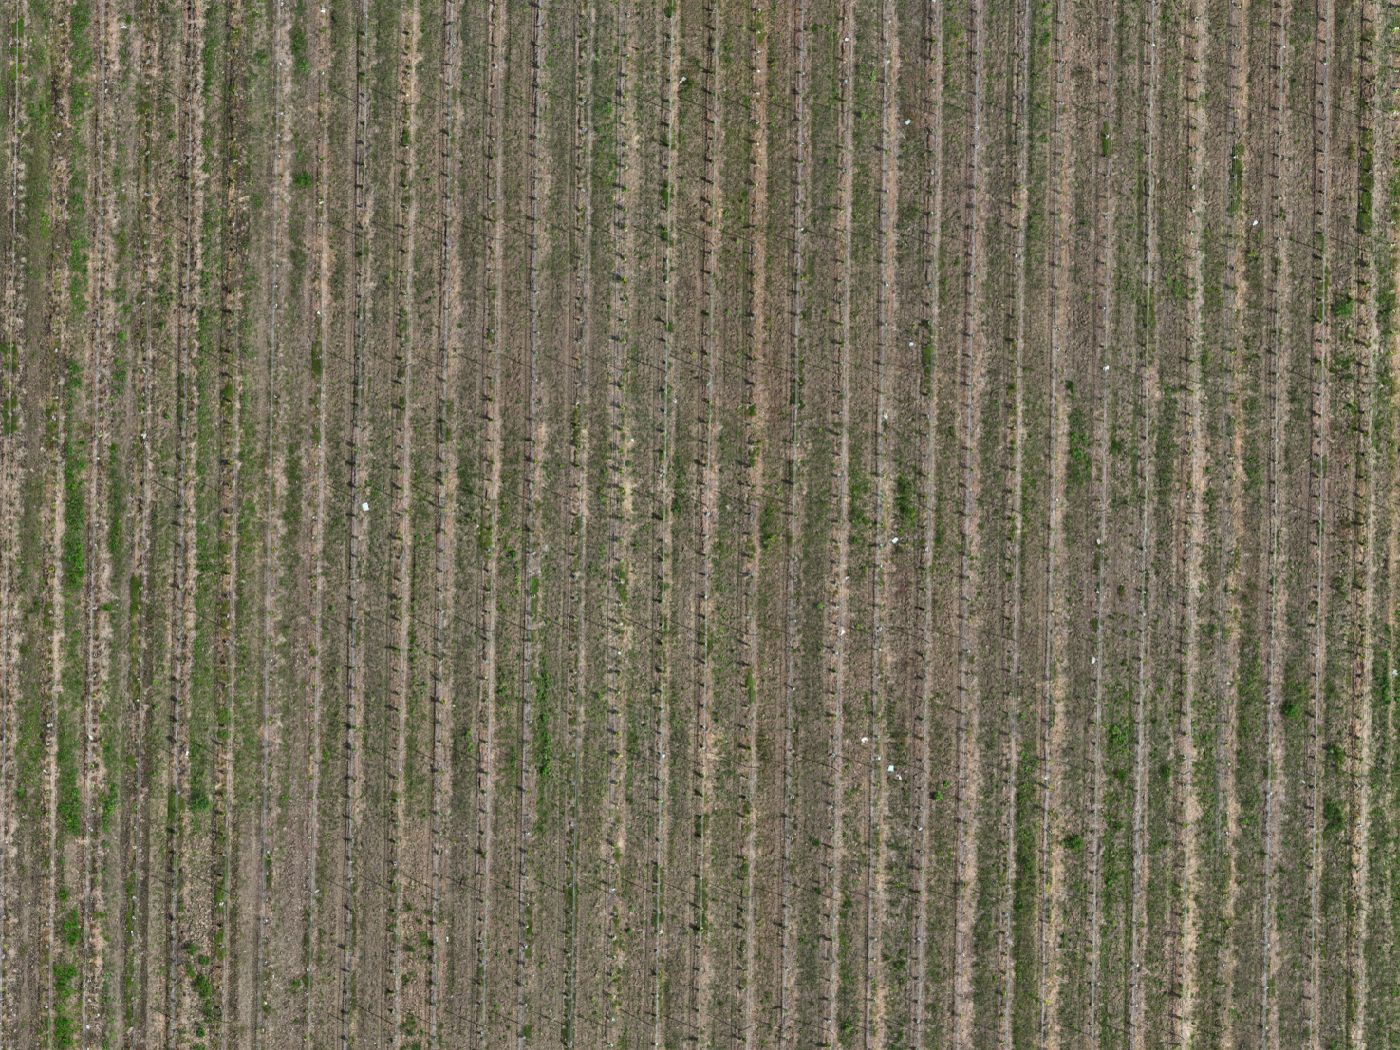
Slide between the true-colour photo and the vigor map of the same rows. The buttons switch between five reads of the same canopy.
The 60-second guide
Every vigor map uses the same colour language. Learn it once and it reads the same in the slider, the viewer, and the report.
The colours grade the vines on a curve within each block. Red does not mean dead. It means look here first.
Roads, bare ground, and gaps between plants stay neutral grey, so only canopy carries a colour.
Each map is coloured on its own range. Compare blocks with the numbers in the tables, not by matching colours across maps.
Five indices read the same canopy differently. A zone soft on several is a stronger flag than one soft on just one.
Want the deeper explainer? Read how vineyard vigor mapping works.
Two families of maps
The five indices fall into two families. One measures how much canopy a vine is carrying; the other reads chlorophyll-sensitive relative patterns in that canopy. Together they catch the vine neither catches alone: big but pale.
The size and density of the leaf canopy. NDVI is the workhorse overview, with OSAVI damping the bare soil between rows. One limit: a dense mid-summer canopy flattens NDVI to uniform green.
Chlorophyll-sensitive patterns: red-edge light reaches deeper than red, so NDRE keeps separating vines after plain greenness flattens out.
In grower terms: one set of maps shows how much canopy there is, the other shows how well fed it is.
Counts, gaps & everything else from one flight
We can also count what's there and map what's missing. Every vine or tree gets counted and every gap located, so the counts and gap map give you a replant number to work from with your nursery. One flight feeds all of it, georeferenced in NAD83(CSRS). Fly it once, or run it across the season.
Vegetation-index maps (NDVI · NDRE · GNDVI · OSAVI · LCI): five reads of the same canopy, delivered as georeferenced GeoTIFF layers for your own GIS.
Observed-vigor zone maps: vigor drawn into editable map layers (SHP · GeoPackage · KML) you open beside your scouting notes.
Vine & tree counts: a per-block count mapped to where each vine or tree stands, plus emergence and stand counts on younger plantings.
Gap & skip maps: missing vines, dead trees, and skips in the planting pattern, flagged by location so a replant plan goes straight to each one.
Season-over-season change: this season's flight set against last season's, block to block.
Files & formats: the PDF report, the orthomosaic and index layers as GeoTIFF, vigor zones as SHP / GeoPackage / KML, class-area tables as CSV, a Google Earth KMZ, an offline GeoPDF for Avenza, and a zoomable web map.
The rest (irrigation zones, nursery counts, sun-exposure and canopy-height maps, Environmental Farm Plan imagery) works the same way. The deeper explainer walks through each one.
Who this is for · how it compares
From the ground you see the rows in front of you. From the air you see the whole block at once: every panel, every gap, every zone where vigor falls off. Vineyards and orchards are the heart of this work, and pasture, hay ground, and mixed farms fit the same flight.
A whole-block read on canopy vigor before veraison, so water, canopy work, and labour go where the season needs them, plus a baseline for next year.
Tree-by-tree vigor, gap and miss detection, and tree counts. The same workflow, tuned to orchard canopy.
A georeferenced map set to open beside your own scouting notes, vigor variability laid out by zone.
The same multispectral read for fairways and greens. Golf courses have their own home: drone services for golf courses.
You already walk the rows, and a satellite pass is free. Here's how a drone flight compares, strengths and limits.
| Kendal Ventures drone | Walking the rows | Satellite | |
|---|---|---|---|
| Resolution | Vine-level detail, roughly 1.7 cm/px, single vines legible | Vine-by-vine where you stand, blind to the rest of the block | Coarse. Many vines per pixel, so fine pattern washes out |
| Frequency & cost | Flown on your schedule, on a clear-sky window | Free, but limited to the ground one person can cover | Fixed orbit schedule; clouds can cost you the date |
| Whole-block view | The entire block in one georeferenced image set | Built up row by row from memory and notes | Whole-block, but too coarse to act vine to vine |
| Turnaround | Flown locally, processed in-house, no outside queue | Immediate, but only for the ground you covered | Depends on the provider's processing and revisit cycle |
| Five indices | NDVI · NDRE · GNDVI · OSAVI · LCI from one flight | What the eye can see | Often one or two broad indices |
A drone map doesn't replace walking the rows. It tells you which rows to walk.
What to fly, when
The canopy tells a different story at each stage. Here's what a flight shows at five points.
An early flight while the canopy is still opening: the first read on how evenly the block is waking up.
What the flight shows: emergence and early uniformity, panel to panel
A flight as the canopy closes in, when vigor zones start to separate.
What the flight shows: in-block vigor zones and canopy density as the rows fill
A flight at colour change, when the spread between strong and stressed zones is at its clearest.
What the flight shows: the season's clearest map of relative vigor, zone by zone
A late flight before the fruit comes off: a final whole-block picture to set against your scouting.
What the flight shows: the late-season vigor pattern against your notes
A closing flight after the pick: how the season ended, and the baseline for next year.
What the flight shows: the season-end baseline for year-over-year comparison
Flying the season as a program? See how a season program works.

Flying the same block across the season
One flight shows a snapshot. Monthly monitoring shows what is changing. Fly the same block through the season (early canopy, veraison, pre-harvest) and ask it straight: did the weak corner respond to the irrigation change, or is it still slipping? An onboard sunlight sensor reads the light through each flight and corrects the maps.
Want this season to compare to last? That's what a repeat program with the reflectance panel is for. It keeps the maps comparable date to date and block to block.
Accuracy figures get published once they're measured on a validated dataset.
Pictured behind: one Summerland block, true colour beside its vigor read.
Straight talk
Here's where the line sits, in plain terms.
Ranks relative vigor across the whole block and puts a precise location on the thin, soft, or slipping zones.
Flags runs and bands where the canopy is not filling evenly.
Counts vines and trees and maps every gap.
Flown as a repeat program with the reflectance panel, it builds a season record comparable date to date.
It never names the cause. Water, nutrients, disease, soil: telling those apart is ground work for you and your agronomist.
It doesn't measure soil moisture or vine water status directly; it reads the canopy's response, so it can't tell over-watering from under-watering.
A single flight is a relative snapshot: the ranking within it is solid; comparing dates takes the repeat program with the panel.
It is never a diagnosis and never a treatment prescription. It does not replace an agronomist, an irrigation inspection, lab testing, or ground truthing. It helps prioritize where to look.
The map tells you where to look. What it means, and what to do about it, stays your call and your agronomist's.
On the horizon · Founding registration open
Two programs, built around the growers who register first. Spray covers fungicide and foliar feeding for vineyards and orchards, launching for the 2027 season. Seeding & spreading handles granular fertilizer, cover crop, and grass seed with the next aircraft. Register your interest now and you're on the list for when it launches. It's free and commits you to nothing.
Founding registration is free and commits you to nothing.
Questions & answers
Flights are flown and processed in-house, so your data never sits in someone else's queue. We set the turnaround at the scope call and put the date in writing.
NDVI reads overall vigor, NDRE and LCI chlorophyll, GNDVI greenness, and OSAVI corrects for bare soil. We lay them out side by side with plain-language observations for you and your agronomist to interpret.
More from the air program
The same RTK capture and in-house pipeline, pointed at another kind of property.
Request a quote
Every project starts with a short scoping call: which blocks, when in the season, and exactly what you'll receive.
Every inquiry gets a reply within one business day.

